


 32 / 103

J
ungerman
I
et
al
.
316
R
ev
A
ssoc
M
ed
B
ras
2017; 63(4):311-319
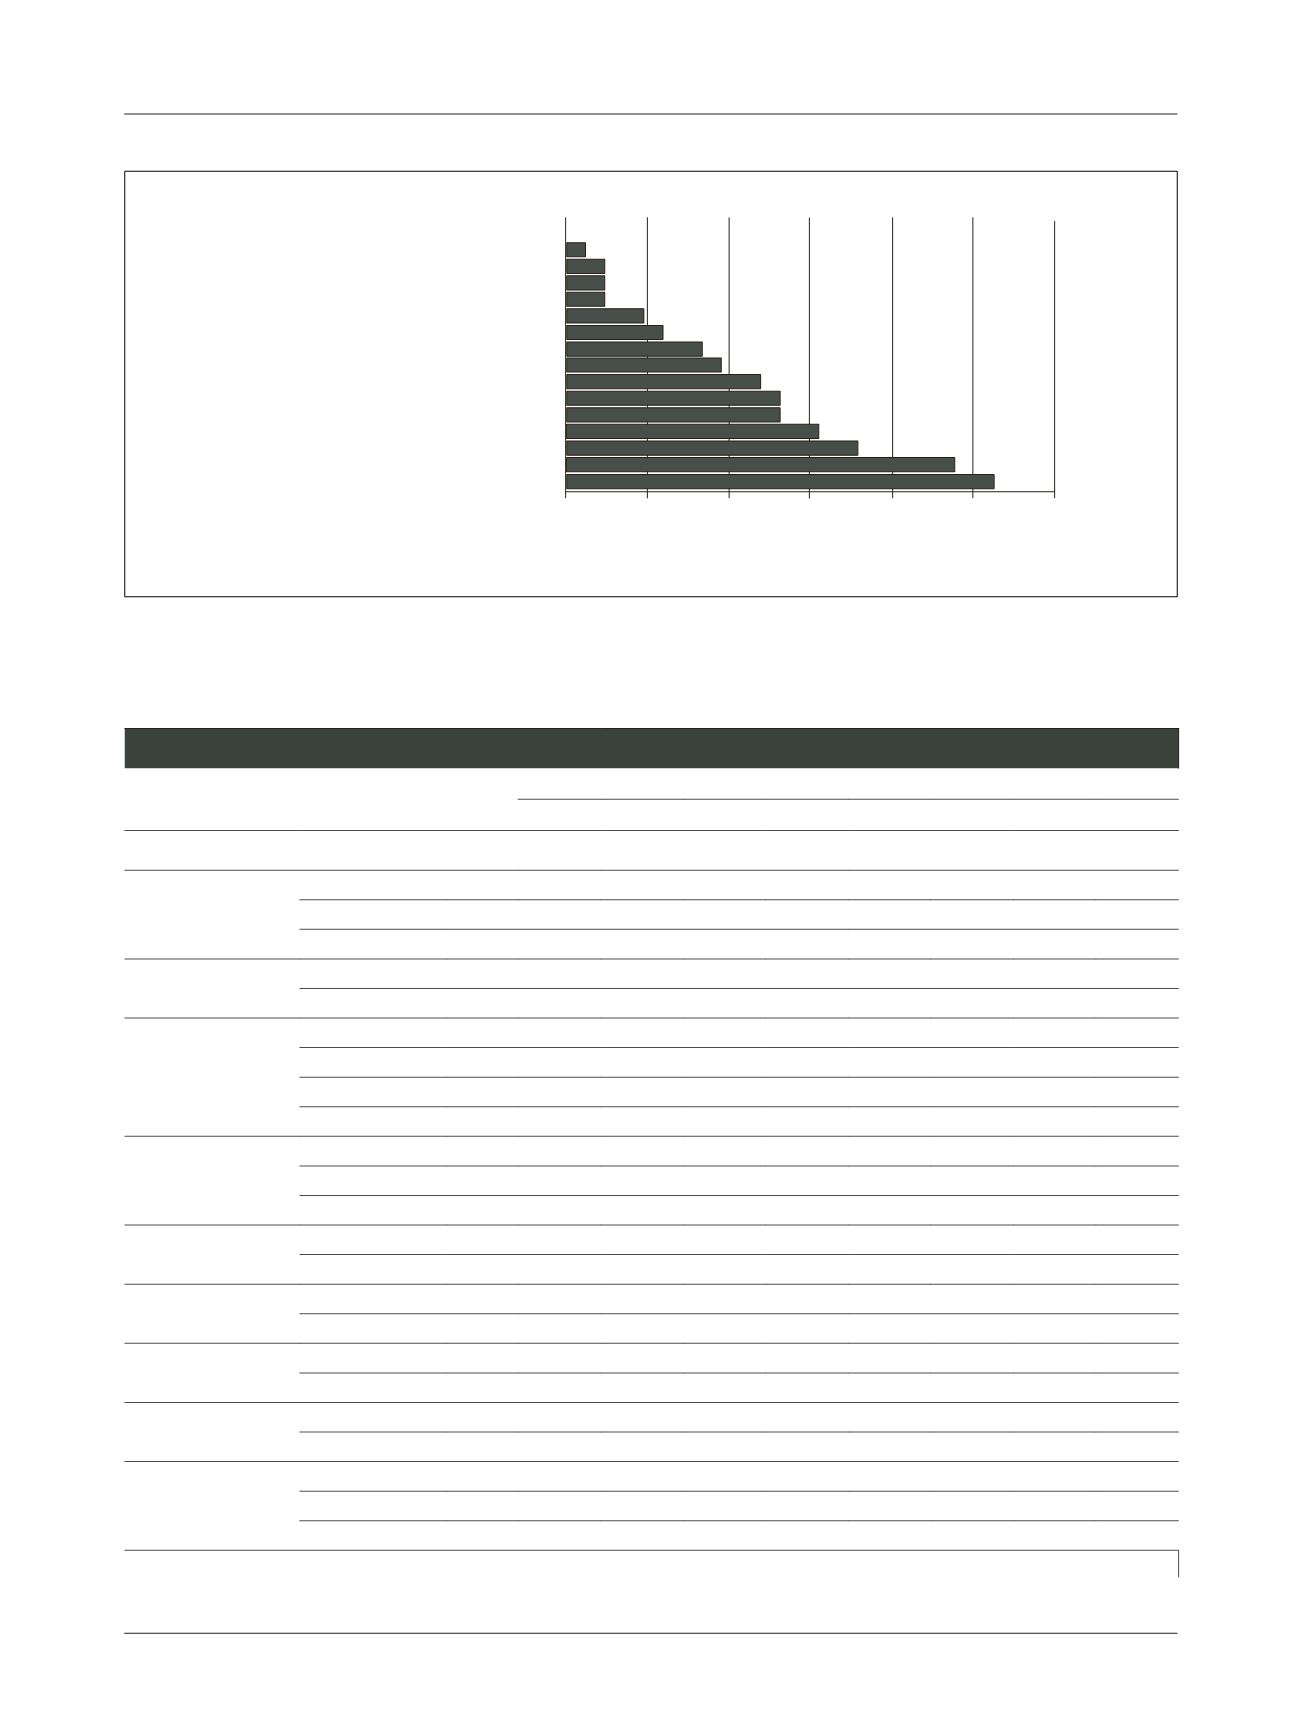
Nursing staff
Clinical nurse specialist
Religious authority/Leader of your religion
Financial advisor
Occupational therapist
Psychiatrist
General practitioner
Social worker
Physiotherapist
Oncologist/Radiotherapist
Surgeon
Oral rehabilitation team
Nutritionist
Psychologist
Dentist
Speech, swallow and language therapist
Frequency (percent)
0
5
10
15
20
25
30
FIGURE 2
The specialists selected most by patients.
TABLE 1
Patients characteristics and the number of items and professional specialists selected in the PCI (n=84).
Number of issues selected
Number of professionals selected
5+ items
2+ professionals
n
Median IQR % n
Median IQR % n
Age
*
<55
20
9
5-12
80
16
2
0-4
60
12
55-64
27
7
4-12
67
18
1
0-3
37
10
≥65
37
9
5-14
78
29
0
0-1
22
8
Gender
Male
62
8
5-13
76
47
0
0-2
31
19
Female
22
10
4-15
73
16
1.5
1-4
50
11
Site of tumor
Oral cavity
35
8
4-13
71
25
1
0-3
31
11
Oropharynx
19
9
5-15
79
15
1
0-3
47
9
Larynx
20
8
5-10
75
15
0
0-2
30
6
Others
10
10
7-13
80
8
1
0-2
40
4
Time from diagnosis
+
(months)
<12
25
13
7-15
84
21
2
0-4
60
15
12-35
22
9
4-12
73
16
0.5
0-2
36
8
≥36
37
7
4-11
70
26
0
0-1
19
7
T stage
T1_2
38
7.5
4-12
66
25
1
0-2
37
14
T3_4
44
8.5
6-14
82
36
0.5
0-3
34
15
N stage
N0_1
59
7
4-12
69
41
0
0-2
27
16
N2_3
24
11
8-15
88
21
2
0-3
54
13
Reconstruction
No
38
8.5
4-12
68
26
1
0-2
34
13
Yes
46
8
5-14
80
37
1
0-3
37
17
RT
No
16
8.5
4-16
63
10
1
0-2
38
6
Yes
68
8
5-13
78
53
1
0-2
35
24
Treatment
Surgery, no RT 21
10
4-17
67
14
1
0-3
48
10
Surgery & RT
34
7
5-11
76
26
0
0-1
21
7
Primary RT
29
9
6-13
79
23
1
0-3
45
13
(
Continues
)