


 109 / 113

U
rinary
EN-2
to
predict
prostate
cancer
: S
ystematic
review
and
meta
-
analysis
R
ev
A
ssoc
M
ed
B
ras
2017; 63(7):656-661
659
FIGURE 2
Results of the evaluation of each study according to Quadas-2.
Patient selection
Index test
Reference standard
Flow and timing
Patient selection
Index test
Reference standard
Risk of bias
Killick et al.
13
Morgan et al.
7
Applicability concerns
–
?
?
+ +
+ +
+ +
+ +
+ +
+
High
Low
Unclear
–
?
+
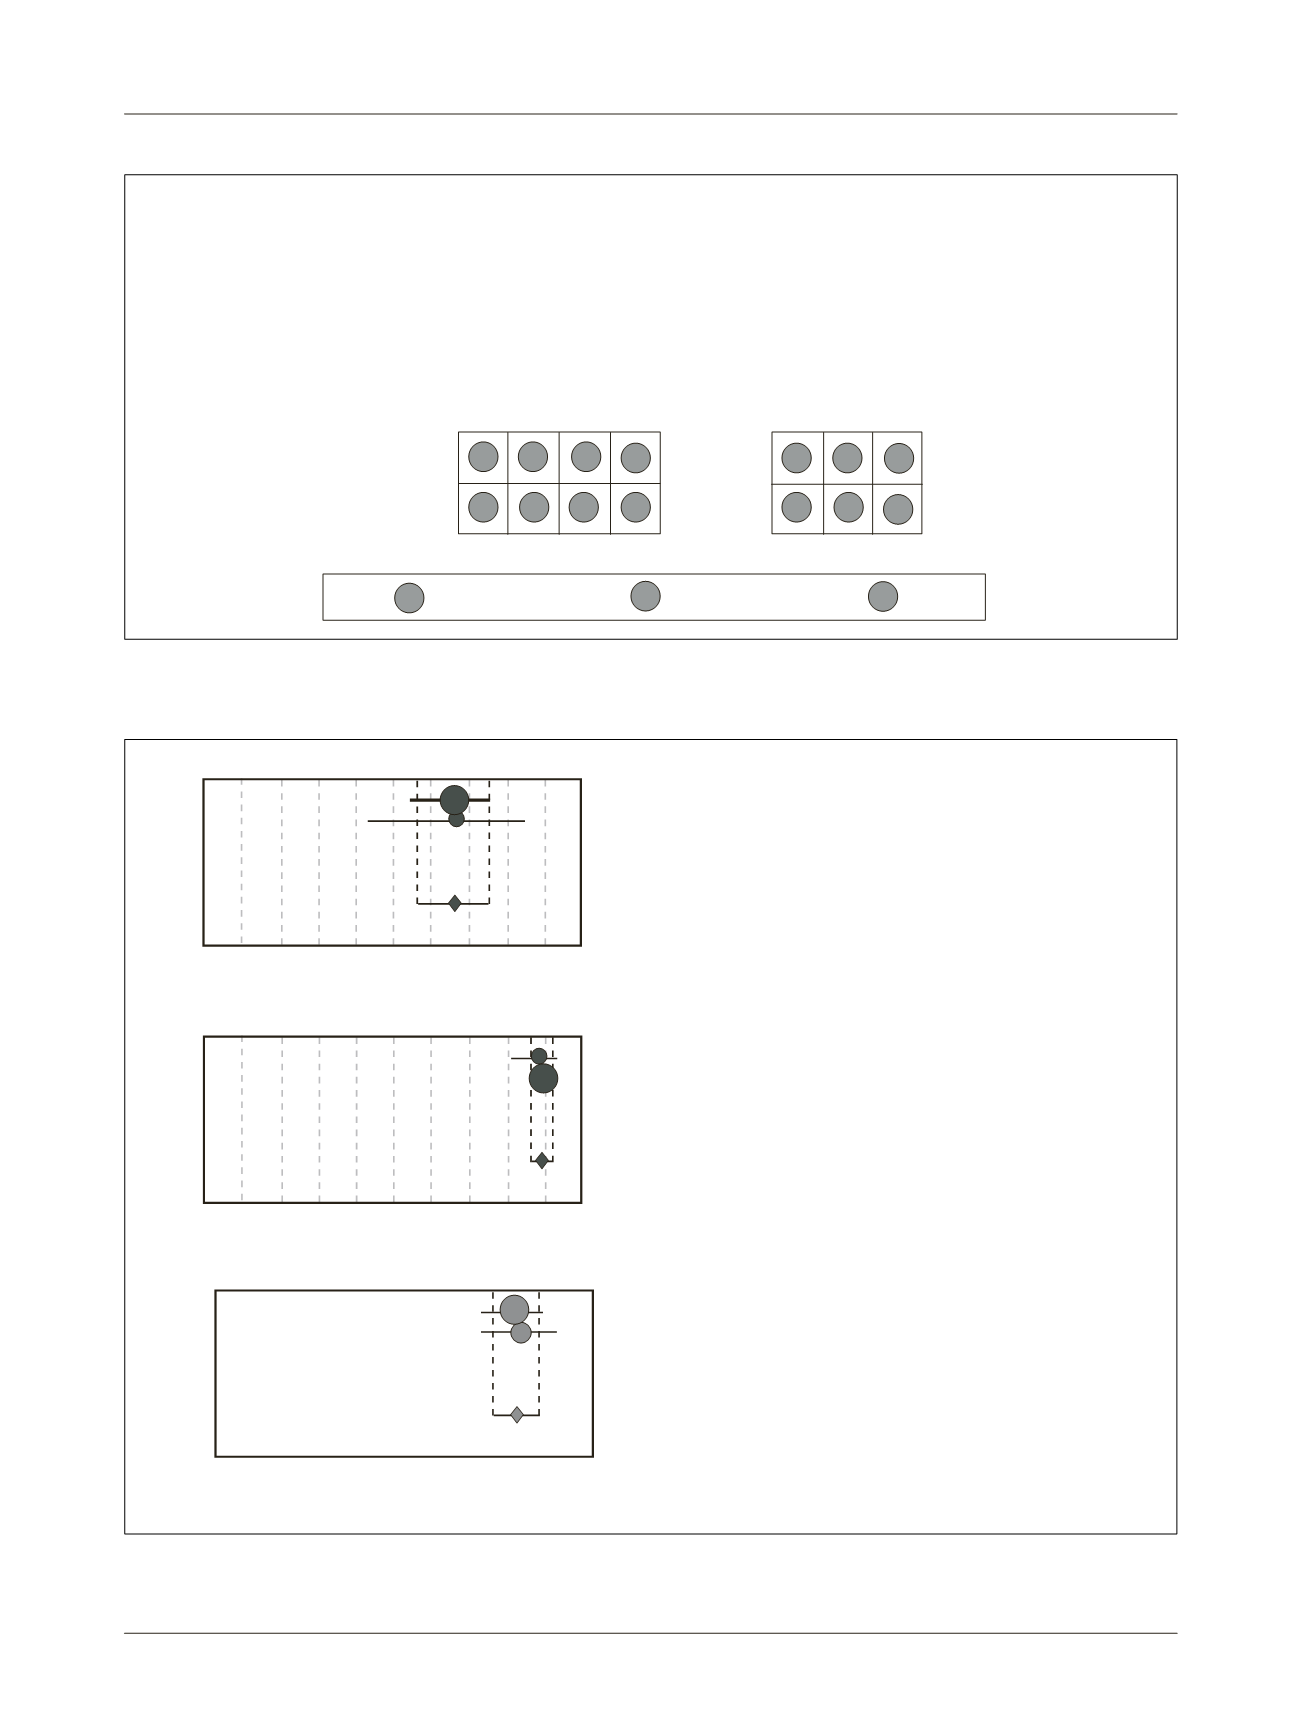
FIGURE 3
Florest plot showing of sensitivity (A), specificity (B) and odds ratio diagnostic (C).
Sensitivity (95CI)
0.66 (0.55-0.76)
0.67 (0.43-0.85)
Pooled sensitivity = 0.66 (0.56 to 0.75)
Chi-square = 0.00; df = 1 (p=0.9440)
Inconsistency (I-square) = 0.0%
Morgan et al.
7
Killick et al.
13
Sensitivity
A
0
1
0.2
0.4
0.6
0.8
Specificity (95CI)
0.88 (0.80-0.94)
0.89 (0.86-0.92)
Pooled specificity = 0.89 (0.86 to 0.92)
Chi-square = 0.09; df = 1 (p=0.7638)
Inconsistency (I-square) = 0.0%
Morgan et al.
7
Killick et al.
13
Specificity
B
0
1
0.2
0.4
0.6
0.8
Diagnostic OR (95CI)
14.46 (6.79-30.80)
16.67 (6.37-43.62)
Fixed effects model
Pooled diagnostic odds ratio = 15.08 (8.43 to 26.98)
Cochran-Q = 0.05; df = 1 (p=0.8176)
Inconsistency (I-square) = 0.0%
Morgan et al.
7
Killick et al.
13
Diagnostic odds ratio
C
1
0.01
100.0