


 14 / 105

T
oledo
SF
et
al
.
298
R
ev
A
ssoc
M
ed
B
ras
2015; 61(4):296-307
ical assessment of RCTs allows to classify them according
to the Jadad score, so that Jadad < 3 trials are considered
inconsistent (
B
), and those with scores ≥ 3, consistent (
A
).
For critical analysis of non-randomized studies, among
them prospective observational studies, the authors used
the Newcastle-Ottawa scale.
8
For results with available evidence, wherever possible,
the following specific items are defined: population, in-
tervention, outcomes, the presence or absence of benefit
and/or damage and controversies.
Cost issues will not be included in the results.
The results will be presented preferably in absolute
data, absolute risk, number needed to treat (NNT), or
number needed to harm (NNH), and occasionally in mean
and standard deviation.
Statistical analysis
The measures of effectiveness or damage expressed in ab-
solute numbers were analyzed using the difference in ab-
solute risk, adopting a confidence interval of 95%. For
statistically significant results, the number needed to treat
to benefit (NNT) and the number needed to treat to harm
(NNH) were calculated. The meta-analysis was performed
using RevMan 5 (Review Manager, Cochrane Collabora-
tion, 2008) software.
Heterogeneity
Inconsistencies among the clinical trials were evaluated
for heterogeneity using chi-square test (Chi
2
) and quan-
tified through I
2
test. Values above 50% were considered
significant.
TABLE 2
Critical assessment script for randomized
controlled trials (checklist).
Study data
Reference, study design, Jadad,
strength of evidence
Sample size calculation
Estimated differences, power,
significance level, total number
of patients
Patient selection
Inclusion and exclusion criteria
Patients
Recruited, randomized,
prognostic differences
Randomization
Description and blinded
allocation
Patient follow-up
Time, losses, migration
Treatment protocol
Intervention, control and
blinding
Analysis
Intention to treat, analyzes of
intervention and control
Outcomes considered
Primary, secondary, measuring
instrument of the outcome of
interest
Result
Benefit or harm in absolute
data, benefit or harm on
average
R
esults
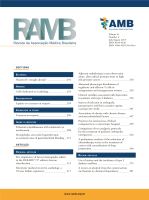
Evidence selected
TABLE 3
Selection process.
Type of publication
Included
Nonrandomized comparative
studies
9
2-10
The main reasons for the exclusion of works were: the un-
availability of the full text; nonrandomized comparative
studies with different study design; studies that includ-
ed preterm fetuses (gestational age <37 weeks), or those
using only the estimated weight of the fetus as a criteri-
on for inclusion. The graphics of the meta-analysis relat-
ing to the works included in the assessment are shown in
the
Appendix
.
The average gestational age is significantly lower in
the group of cesarean delivery with no indication as com-
pared to the planned vaginal delivery group in four of the
five studies evaluating this outcome (Table 4) (
B
).
3-6,9
The
mean birth weight is assessed in five studies, and in one
work, only the mean weight is significantly higher in the
cesarean group without indication (Table 5) (
B
).
3-6,8
Effect of cesarean section on maternal request or without
indication on maternal mortality
Three studies evaluate maternal mortality (
B
);
2-4
howev-
er, only one study has events for this outcome (
B
).
8
The
Included n=9
comparative studies
Retrieved
n=1482
Excluded
n=1187
Selected based on title
n=295
Excluded n=222
Assessment of full text
n=73
FLOWCHART 1
Study selection.