


 19 / 105

C
esarean
on
request
R
ev
A
ssoc
M
ed
B
ras
2015; 61(4):296-307
303
A
ppendix
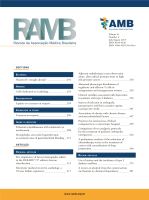
Meta-analysis charts
CDMR
Vaginal delivery
Risk difference
Risk difference
Study or
subgroup
Events Total Events Total
Weight M-H, fixed, 95%
CI
Year M-H, fixed, 95% CI
Karlström,
2013
579 5877 935 13774 46.9% 0.03 [0.02, 0.04] 2013
-0.05 -0.025
0.05
0
Favours [CS]
Favours [VD]
0.025
Crowther,
2012
9
1098 29
1225 6.6% -0.02 [-0.03, -0.01] 2012
Larsson,
2011
25
247 41
294
1.5% -0.04 [-0.09, 0.02] 2011
Wang, 2010 12
301 2
301
1.7% 0.03 [0.01, 0.06] 2010
Souza, 2010 27
2685 2138 212590 30.2% -0.00 [-0.00, 0.00] 2010
Dahlgren,
2009
10
1046 189 38021 11.6% 0.00 [-0.00, 0.01] 2009
Schindl,
2003
10
147 17
903
1.4% -0.02 [-0.03, -0.01 2003
Total
(95% CI)
11401
267108 100% 0.01 [0.01, 0.02]
Total events 662
3351
Heterogeneity: Chi
2
– 135.12, df = 6 (p < 0.00001): I
2
= 96%
Test for overall effect: Z = 5.99 (p < 0.00001)
FIGURE 1.1
Bleeding complications.
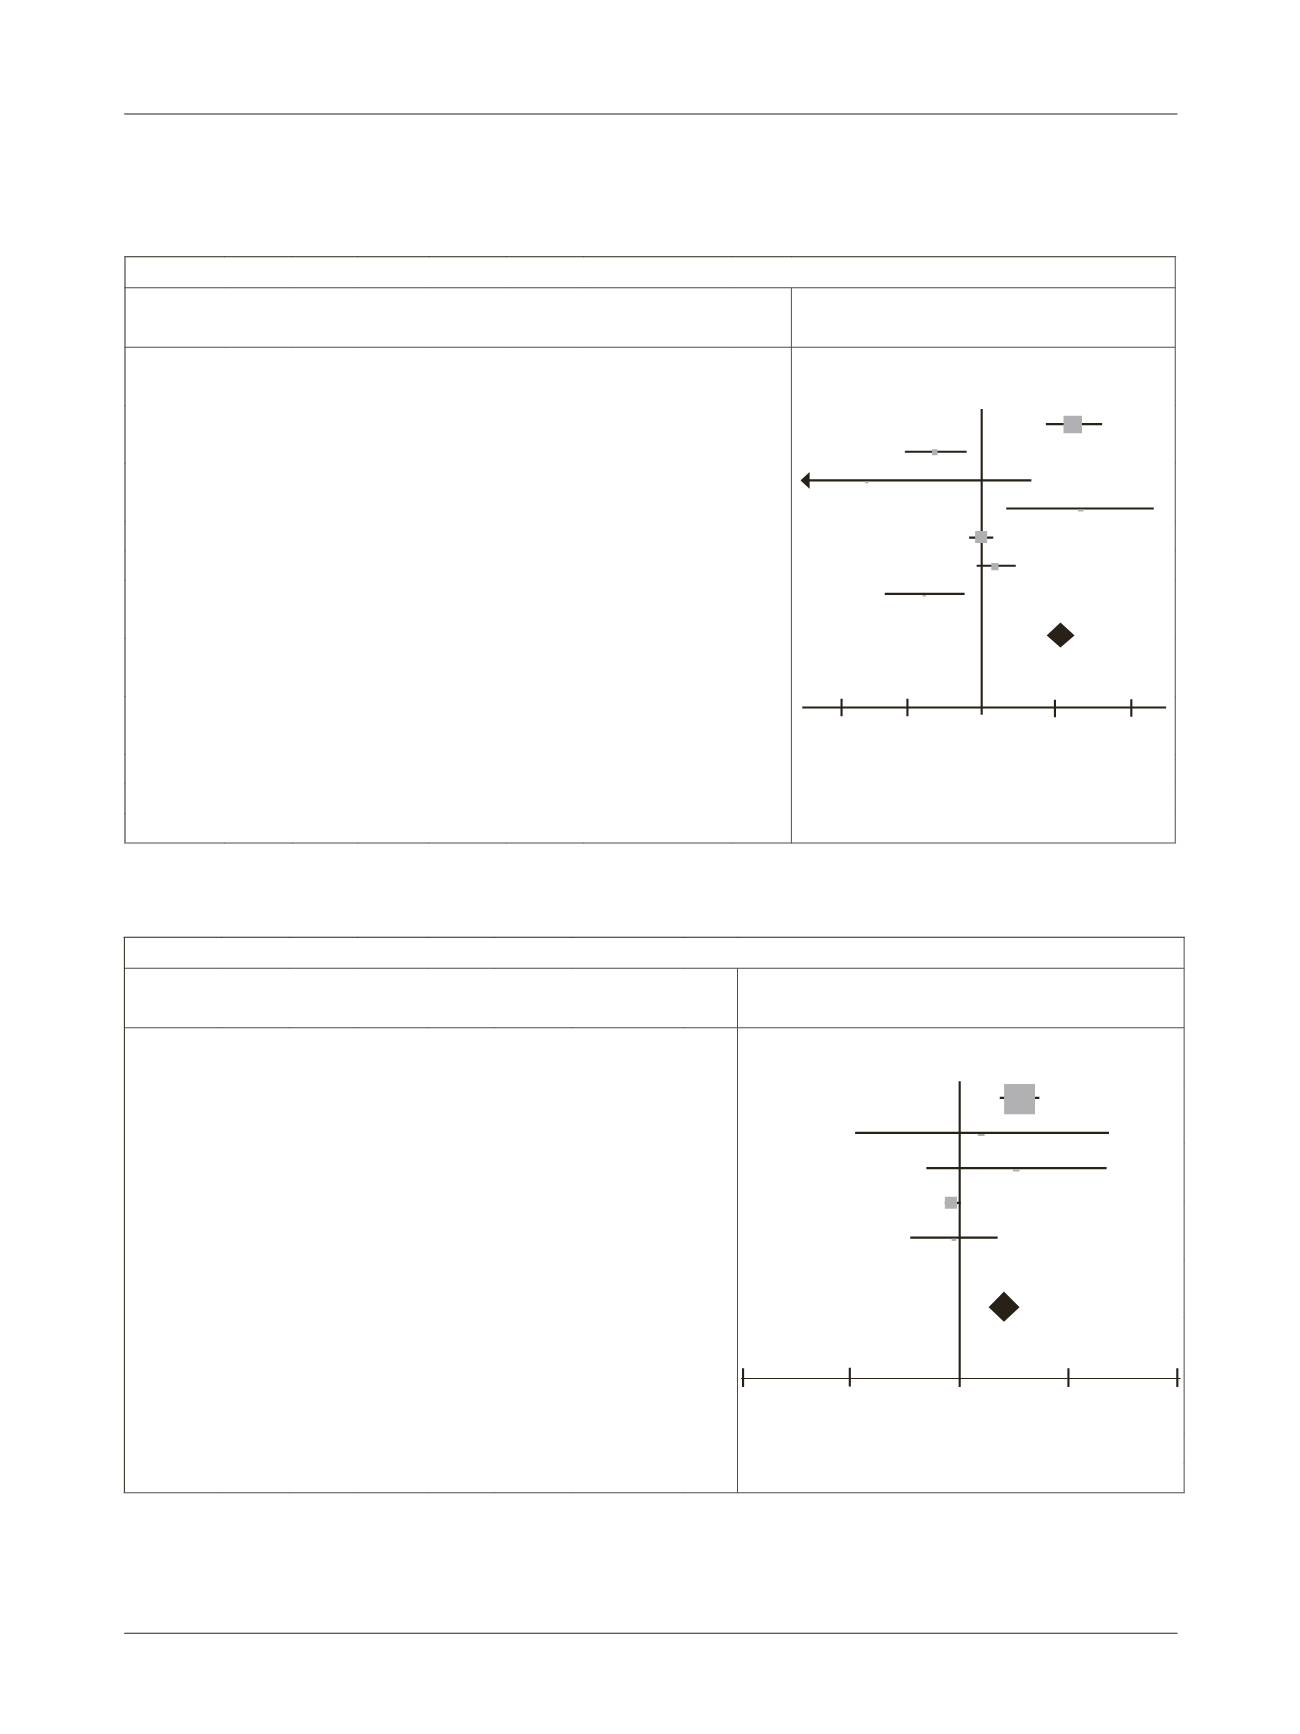
CDMR
Vaginal delivery
Risk difference Risk difference
Study or
subgroup
Events Total
Events Total
Weight M-H, fixed,
95% CI
Year M-H, fixed, 95% CI
Karlström,
2013
148 5877 155 13774 74.2% 0.01 [0.01,
0.02]
2013
-0.05
0.05
0
Favours [CS]
Favours [VD]
0.025
Larsson,
2011
8
247 8
294 2.4% 0.01 [-0.02,
0.03]
2011
Wang,
2010
7
301 3
301 2.7% 0.01 [-0.01,
0.03]
2010
Dahlgren,
2009
1
1046 104 38021 18.3% -0.00 [-0.00,
0.00]
2009
Schindl,
2003
0
147 1
903 2.3% -0.00 [-0.01,
0.01
2003
Total
(95% CI)
7618
53293 100% 0.01 [0.01,
0.01]
Total
events
164
271
Heterogeneity: Chi
2
– 160.55, df = 4 (p < 0.00001): I
2
= 98%
Test for overall effect: Z = 6.05 (p < 0.00001)
FIGURE 1.2
Infectious complications.