


 54 / 103

S
ilveira
LAM
et
al
.
338
R
ev
A
ssoc
M
ed
B
ras
2017; 63(4):336-340
R
esults
Thirty patients were selected, with 15 cases of alcoholic liver
cirrhosis found in the analyzed period, corresponding to 4.2%
of autopsy reports, and 15 without cirrhosis. The patients
were divided into four groups: group 1 (mild atherosclerosis,
without cirrhosis), group 2 (moderate and severe atheros-
clerosis, without cirrhosis), group 3 (mild atherosclerosis,
cirrhotic), and group 4 (moderate and severe atherosclerosis,
cirrhotic). The general characteristics of the samples were
analyzed with descriptive methods presented in Table 1.
TABLE 1
General characteristics of the samples.
Data
Cirrhotic
(n=15)
Non-cirrhotic
(n=15)
Total
(n=30)
Atherosclerosis
Mild
10
13
23
Moderate and severe 5
2
7
Gender
Female
4
5
9
Male
11
10
21
Color
White
12
10
22
Non-white
3
5
8
By associating liver fibrosis with cirrhosis and atheroscle-
rosis, we found that cirrhotic patients with mild atheros-
clerosis showed a higher percentage of liver fibrosis than
cirrhotic patients with moderate and severe atheroscle-
rosis (p<0.0001).
As for aortic fibrosis, cirrhotic patients had a signifi-
cantly higher percentage of fibrosis than the non-cirrhot-
ic ones (p<0.0001). Among those with moderate and severe
atherosclerosis, the degree of atherosclerosis was higher
in cirrhotic patients (p<0.0001).
Considering the association of BMI with cirrhosis
and atherosclerosis, cirrhotic patients with mild athero-
sclerosis had higher BMI than those with moderate and
severe atherosclerosis (p=0.0017).
Analyzing all patients, in general and in groups, both
BMI and macroscopic atherosclerotic severity signifi-
cantly increased with age (p<0.0001 for all correlations).
However, with advancing age, aortic fibrosis decreased
significantly (p<0.0001) in groups 3 and 4 (cirrhotic).
In all groups, the BMI increased significantly with
liver fibrosis (p<0.0001 for all correlations). The macro-
scopic degree of atherosclerosis increased significantly
with the increase of liver fibrosis in all groups (p<0.0001).
Aortic fibrosis decreased significantly with hepatic fibro-
sis only in group 3 (p<0.0001).
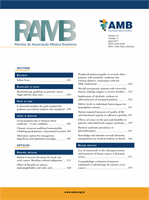
FIGURE 1
Histologic section of the intima layer in human aorta
under polarized light, stained with picro-sirius, with end magnifica-
tion of 800x. Discrete fibrosis is observed.
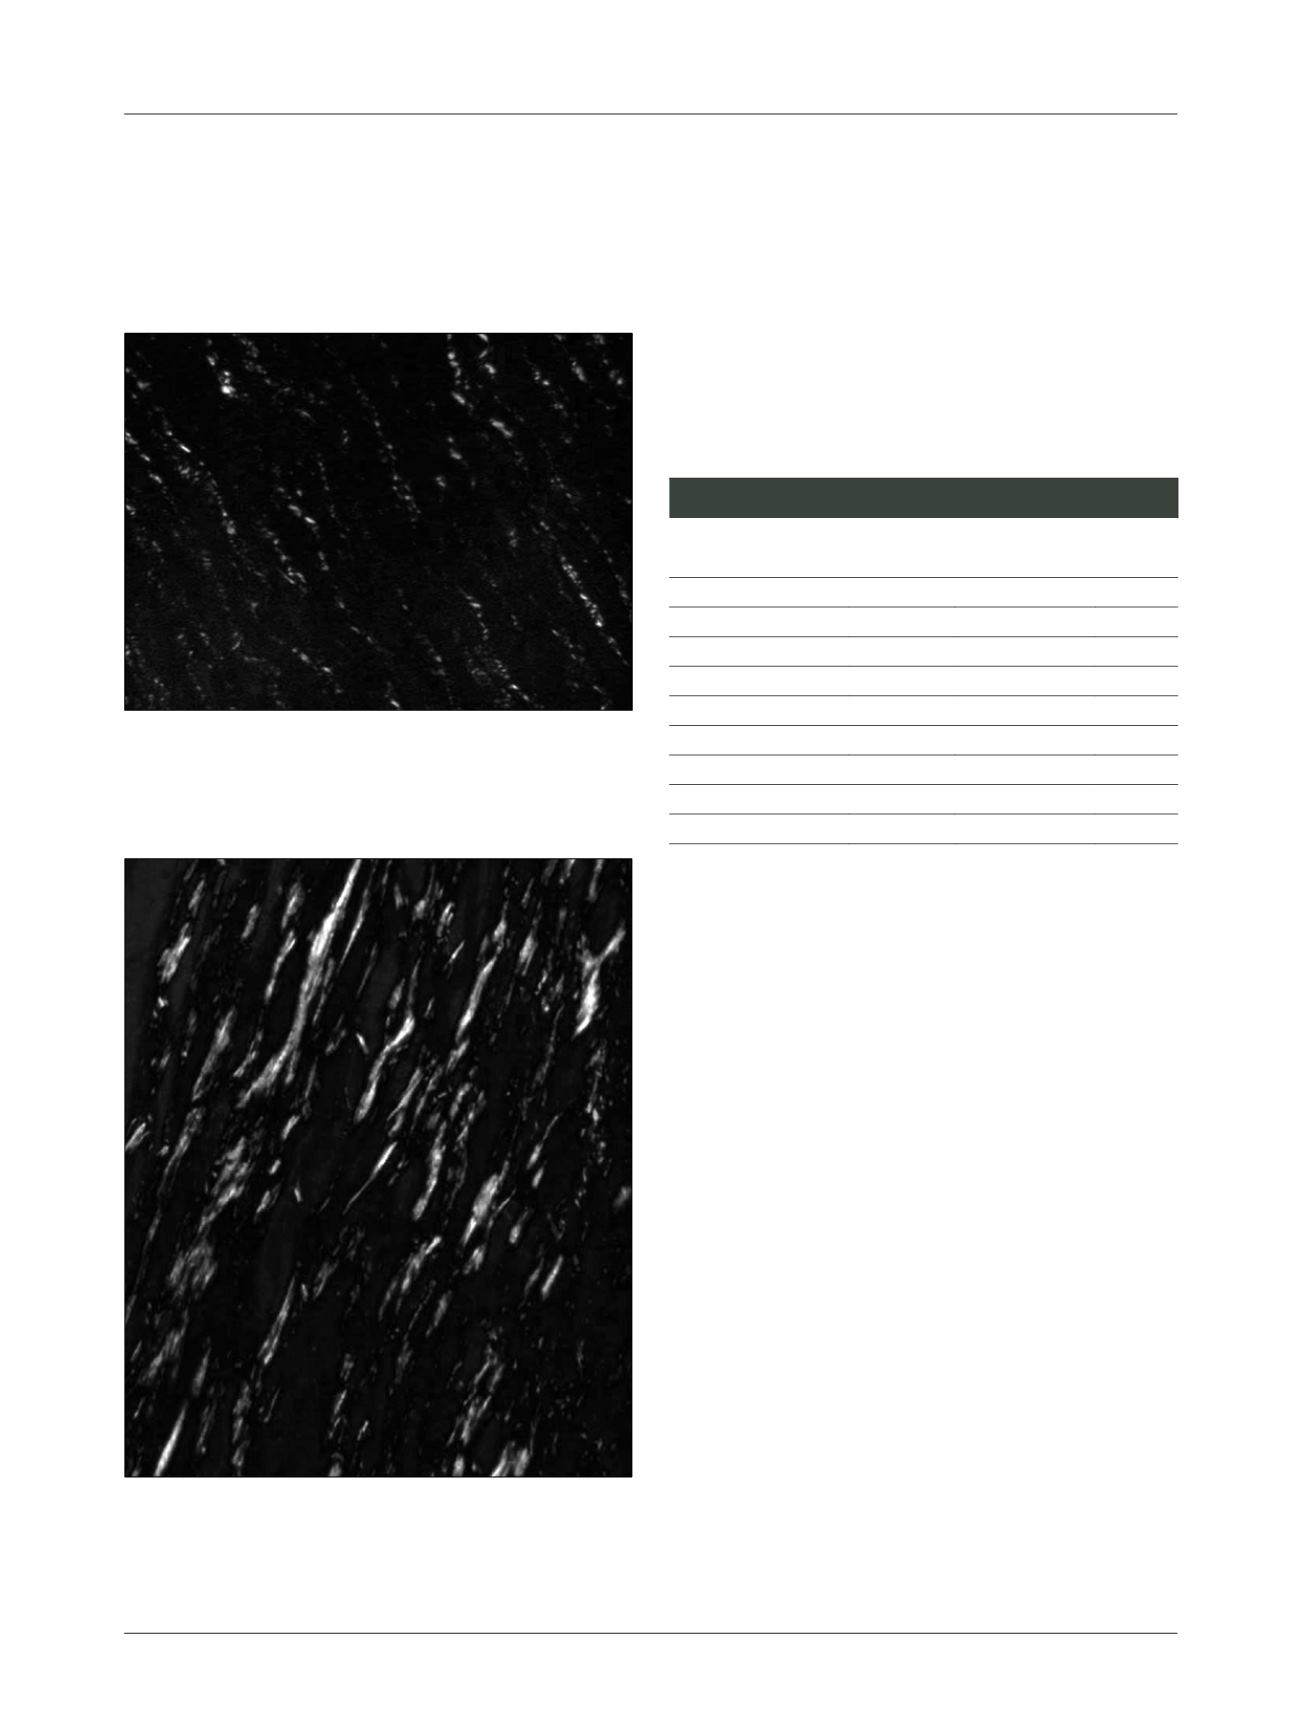
FIGURE 2
Histologic section of the intima layer in human aorta
under polarized light, stained with picro-sirius, with end magnifica-
tion of 800x. Pronounced fibrosis is observed.
-normal, we used Mann-Whitney test to compare the two
groups and Kruskall-Wallis test for comparison between
three or more groups. The Spearman correlation coef-
ficient was used to correlate two variables. Differences
were considered statistically significant at p<0.05.