
B
urnout
syndrome
prevalence
in
physiotherapists
R
ev
A
ssoc
M
ed
B
ras
2017; 63(4):361-365
363
TABLE 1
Components of burnout syndrome for the main categorical variables; mean (± standard deviation).
N EE
Dp
LPA
MBI
Total
115 20.02 (11.33)
7.45 (5.42)
37.77 (7.39)
65.23 (14.37)
Number of working hours per week
< 38.5
52 18.08 (10.62)
7.42 (5.5)
36.46 (7.86)
61.96 (14.26)
> 38.5
63 21.71 (11.78)
7.35 (5.33)
38.89 (6.91)
67.95 (14.11)
Type of working day
Consecutive
43 19.23 (10.69)
8.09 (8.81)
35.19 (7.97)
62.51 (14.21)
Split shifts
73 20.48 (11.74)
7.07 (5.19)
39.29 (6.63)
66.84 (14.31)
Number of hours of direct
attention to patients and family
< 10
8
12.63 (8.65)
4.50 (3.66)
43.63 (5.53)
60.75 (11.76)
11-20
12 14.50 (10.81)
4.75 (3.86)
40.08 (8.24)
59.33 (13.42)
21-40
65 20.05 (10.39)
7.68 (5.38)
36.72 (7.19)
64.45 (14.04)
> 40
22 25.05 (13.08)
8.09 (6.17)
39.73 (7.18)
72.86 (14.36)
Number of patients treated per day < 20
55 16.93 (10.23)
6.36 (4.86)
38.84 (7.15)
62.13 (13.49)
> 20
54 22.46 (11.39)
8.87 (5.79)
37.00 (7.79)
68.33 (14.72)
Type of practice
Public
24 19.17 (9.57)
8.12 (5.31)
34.42 (6.98)
61.71 (12.44)
Private
78 19.68 (11.54)
6.85 (5.21)
39.27 (6.70)
65.79 (14.87)
Both
13 24.31 (13.09)
10.15 (6.44)
35.46 (9.78)
69.92 (13.35)
EE: emotional exhaustion; Dp: depersonalization; LPA: low professional accomplishment; MBI: Maslach Burnout Inventory.
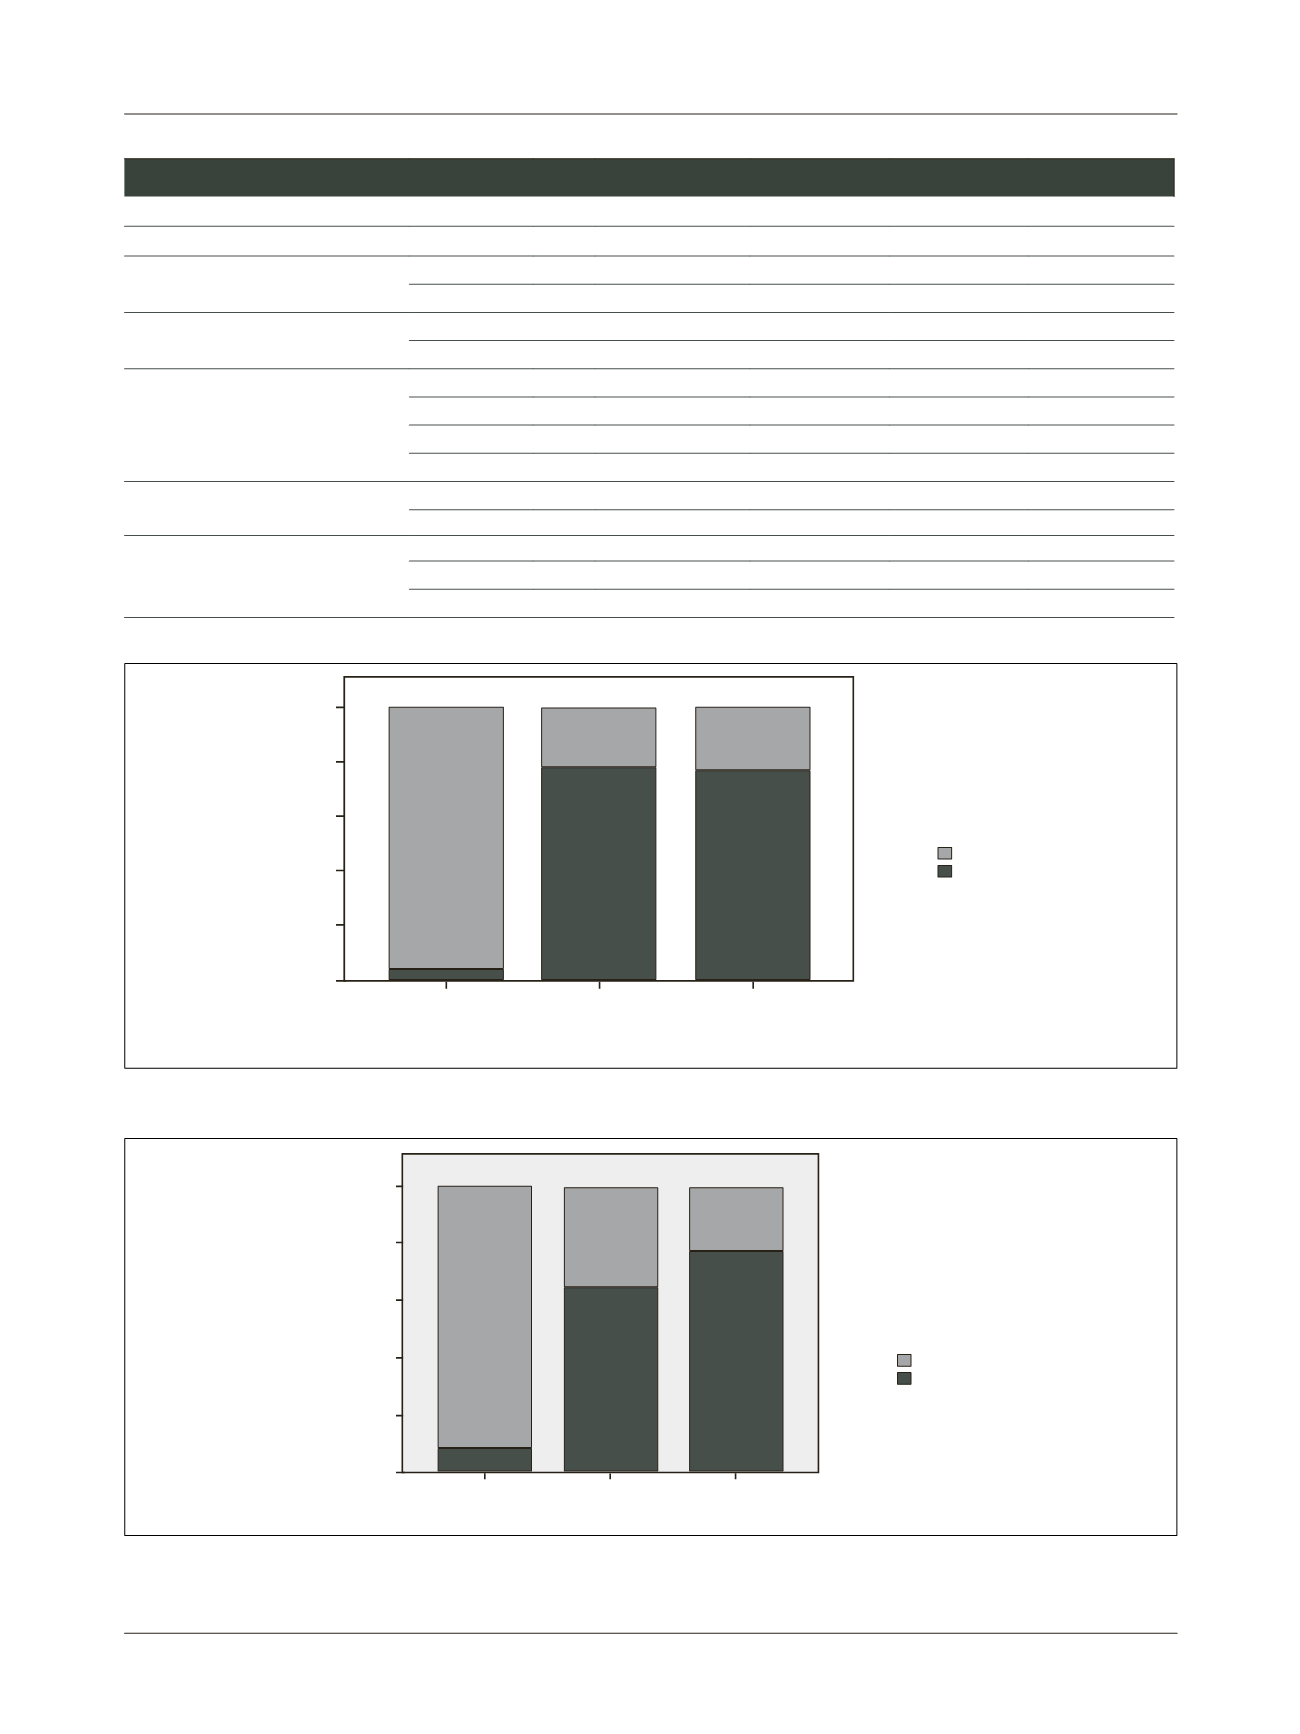
FIGURE 2
Working hours per week by type of practice.
FIGURE 1
Type of working day per type of practice.
% per type of practice
Public
Private
Both
Type of
working
day
Consecutive
Split shifts
Type of practice
100.0%
80.0%
60.0%
40.0%
20.0%
0.0%
% working hours by type of practice
Working
hours
< 38.5
> 38.5
Type of practice
Public
Private
Both
100.0%
80.0%
60.0%
40.0%
20.0%
0.0%


