


 96 / 105

H
epner
A
et
al
.
816
R
ev
A
ssoc
M
ed
B
ras
2017; 63(9):814-823
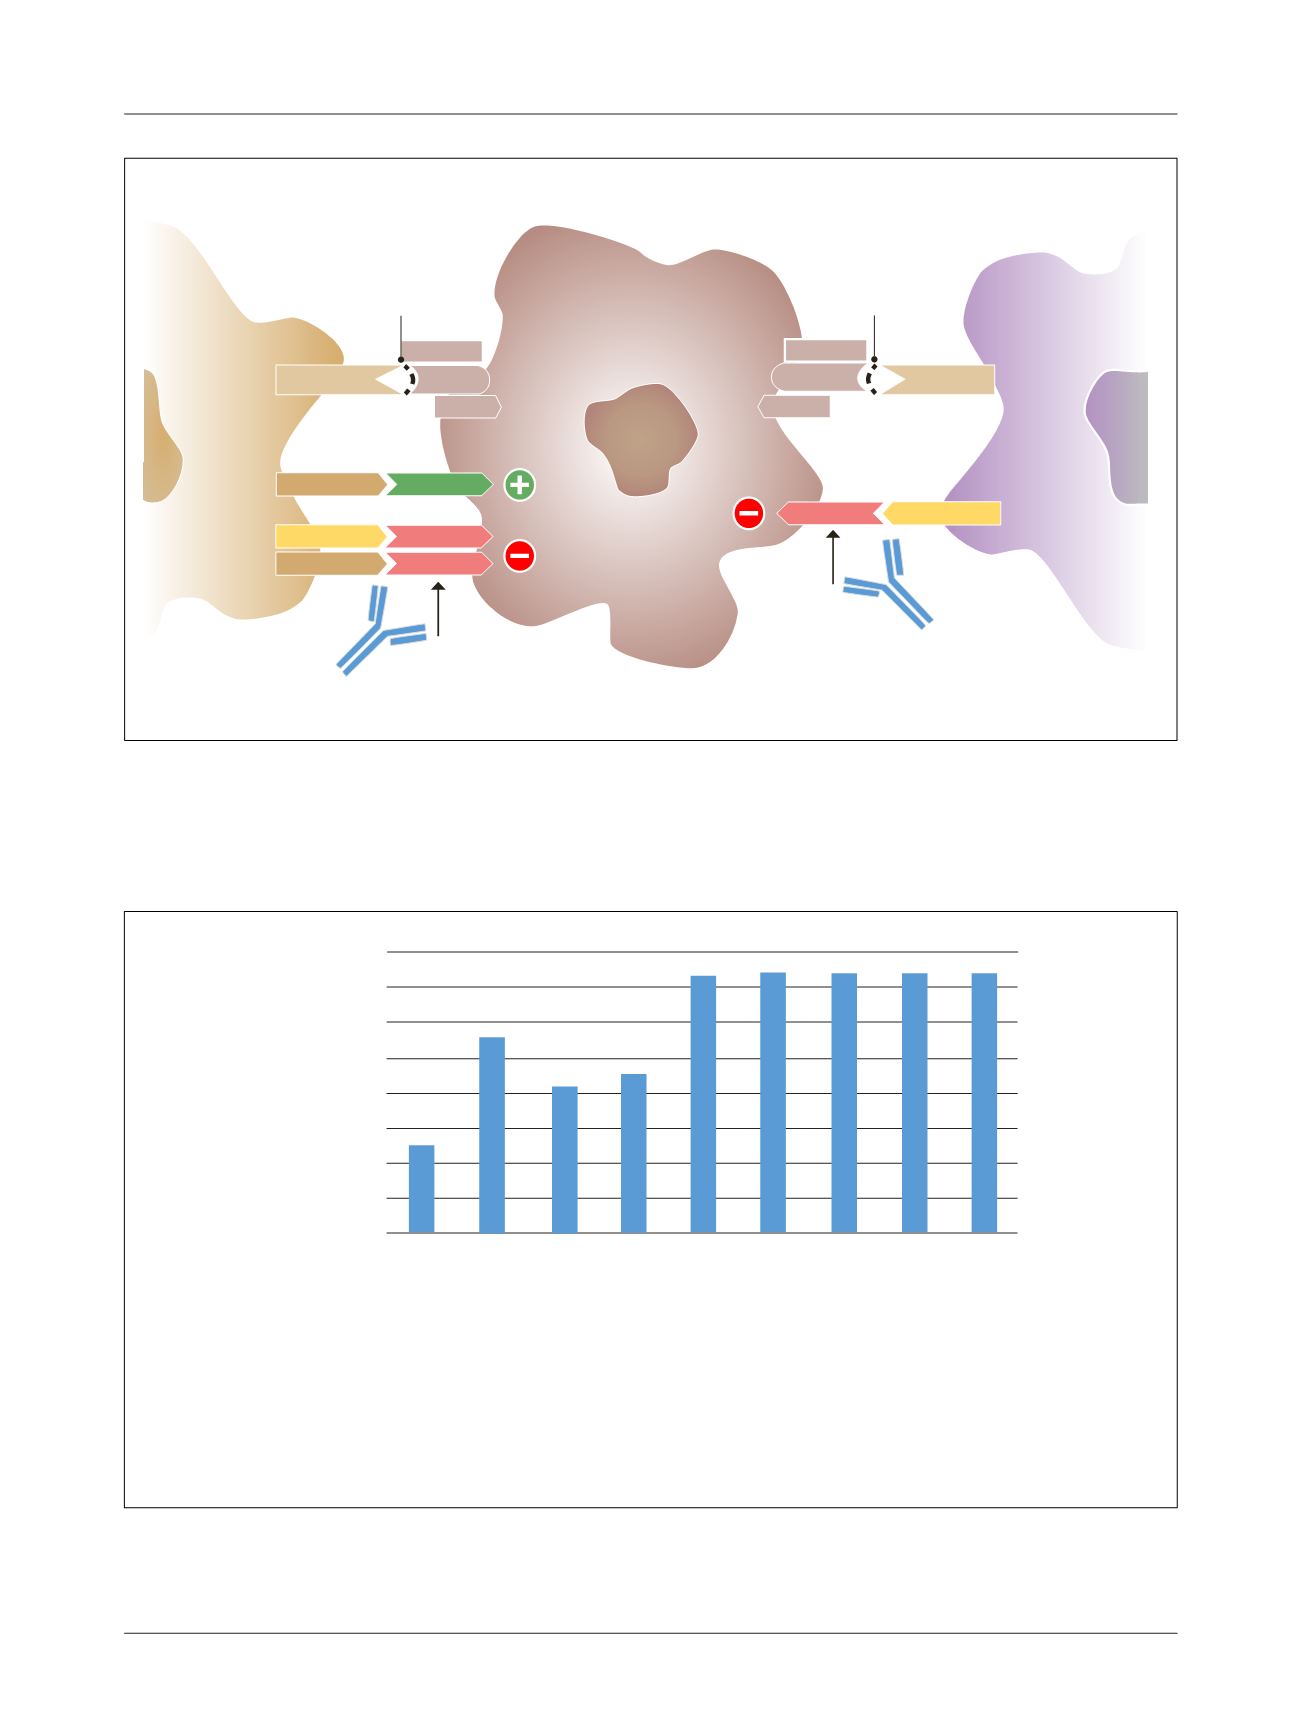
FIGURE 3
12-month overall survival rates across different studies.
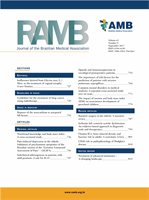
FIGURE 2
CTLA-4 and PD-1/PD-L1 in the immune synapse.
MHC: major histocompatibility complex; TCR: T cell receptor; CD: cluster of differentiation; B7.1 and B7.2 proteins; CTLA4: cytotoxic T lymphocyte associated antigen 4; PD1: programmed cell
death protein 1; PD-L1: programmed death-ligand 1; PD-L2: programmed death-ligand 2.
B71 or B72
PD-L1 or PD-L2
CD3
B71 or B72
CD28
PD-1
CTLA4
MHC
TCR
CD4 or CD8
MHC
TCR
Tumor
T Cell
APC
Priming phase
Effector phase
CD3
PD-1
Peptide
Antigen
Peptide
Antigen
Anti-CTLA4
Anti-PD-1
PD-L1 or PD-L2
CD4 or CD8
80%
70%
60%
50%
40%
30%
20%
10%
0%
Survival probability
Dacarbazine
Vemurafenib
Dabrafenib
Ipilimumab
Nivolumab
Pembrolizumab
Vemurafenib + cobimetinib
Dabrafenib + trametinib
Ipilimumab + nivolumab
Treatment