


 18 / 105

V
almórbida
JL
et
al
.
738
R
ev
A
ssoc
M
ed
B
ras
2017; 63(9):736-740
When asked about the factors that most influence
food choice, the most commonly reported alternative was
“attempt to maintain a healthy diet” (53%), followed by
“taste of the food” (31%) and “routine” (24%). The level of
knowledge of the patients who chose the alternative “taste”
as one of the main influences in food choice was signifi-
cantly lower than those who did not choose this alterna-
tive. Those who claimed to choose food items in accor-
dance to a diet or to follow a healthy diet had a higher
degree of knowledge than those who did not.
Regarding the main sources of information about
food and nutrition, 67.3% of the patients (177) pointed
to television as one of the main sources, followed by
health professionals (29%), newspaper (23%) and nutri-
tionists (16%).
D
iscussion
The main finding in our study was an inverse and sig-
nificant correlation between BMI and WC/WHR, as well
as the percentage of the participants’ correct answers.
Even though some findings do not corroborate the
results of the study,
14-18
these are still relevant data. By
demonstrating that the level of knowledge about food
and nutrition has a significant impact on the nutritional
status (noting that participants who scored less in the
questionnaire had the worst results for BMI, WC and
WHR), we can justify the importance of developing pub-
lic policies to raise awareness of healthy eating habits and
self-care among individuals presenting CNCDs.
In our study, both men and women had high WC and
WHR. WC and WHR have a known relation with the
amount of abdominal fat, and high values are indicators
of risk for the development of cardiovascular disease.
The participants obtained a middling score on the
questionnaire, similar to that found in other studies,
19,20
except for O’Brien et al.,
21
who found a good level of knowl-
edge. Formal education was related to the mean of correct
answers, and low levels of education are probably related
to the result found, which is in agreement with the litera-
ture.
22
Differently from another study, our results showed
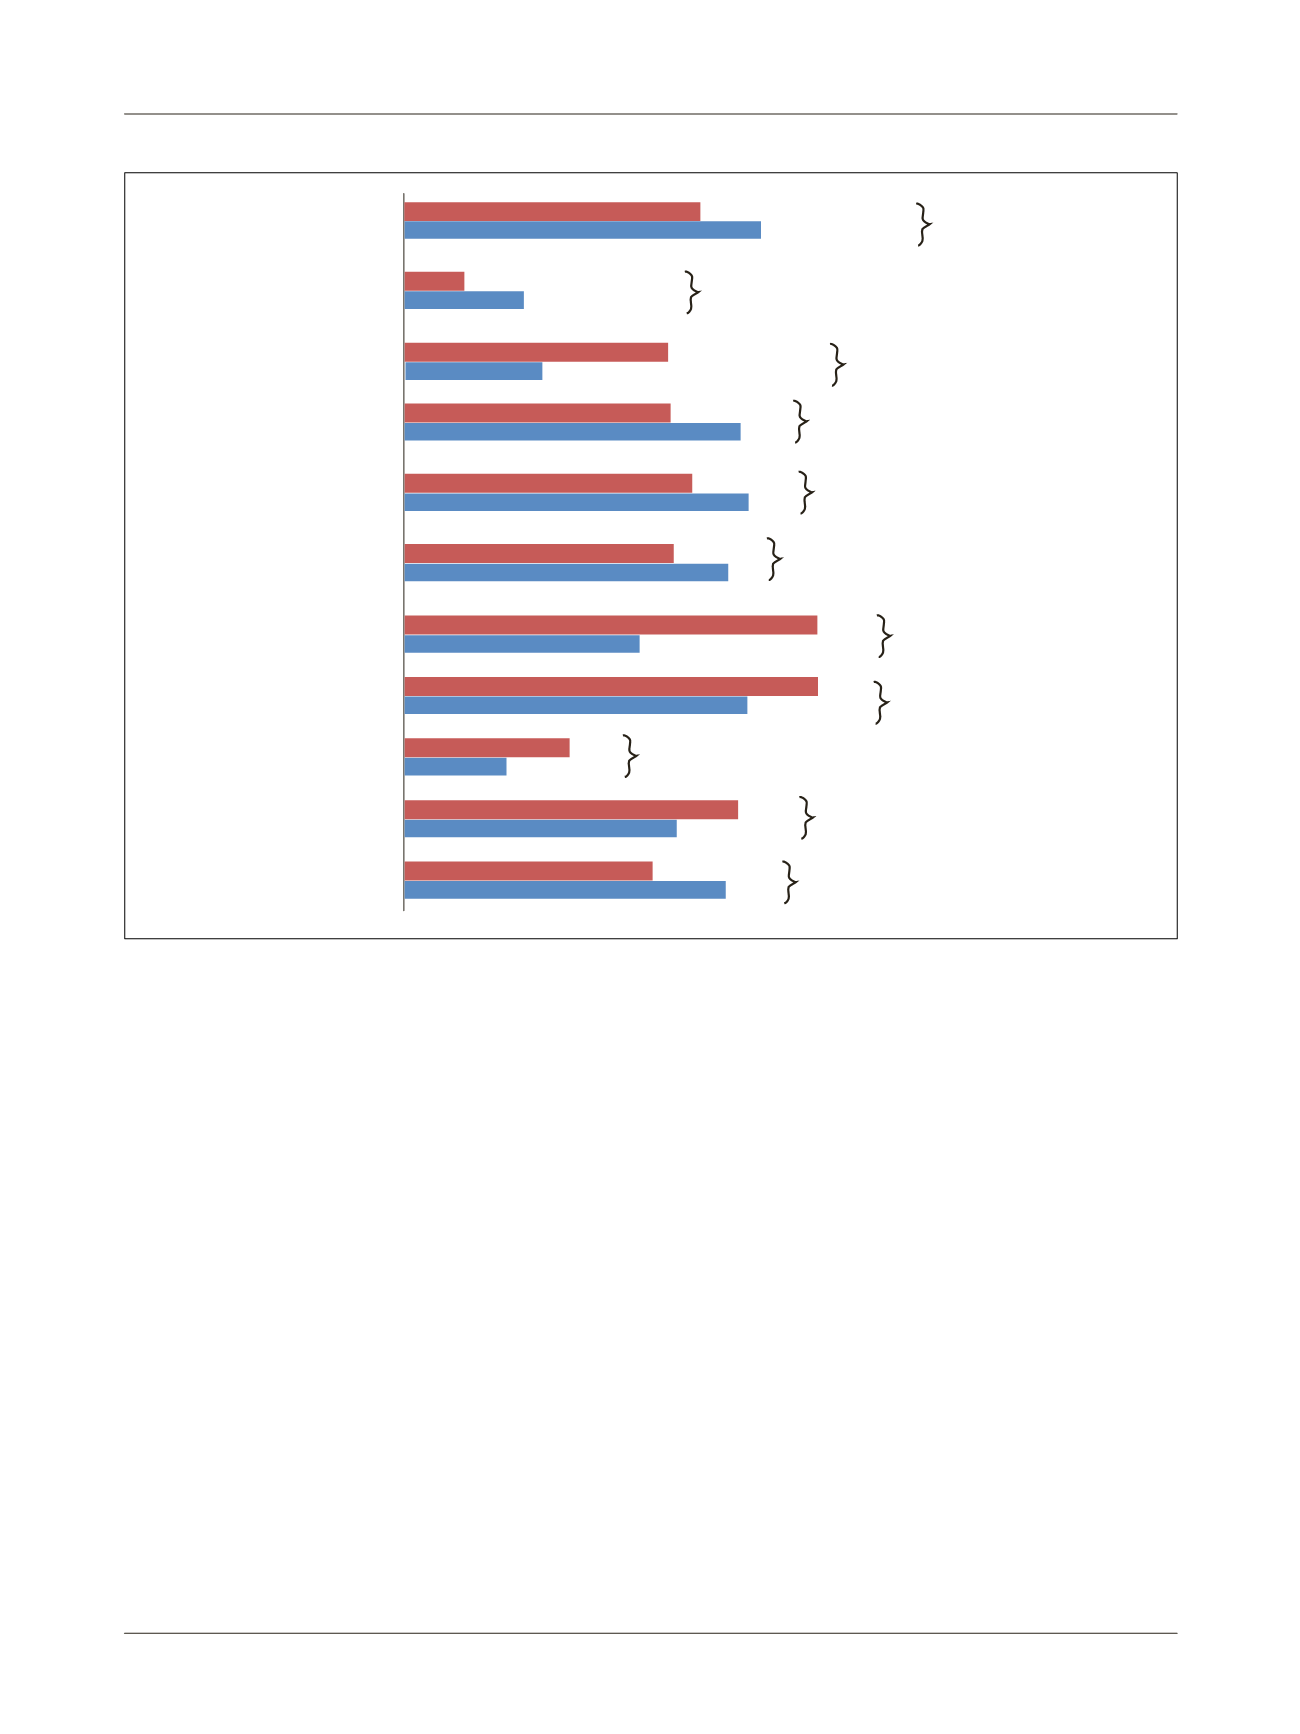
FIGURE 1
Relation between the presence of chronic noncommunicable disease and the mean of correct responses in percentages and p-value.
Fiber content
Fruit recommendation
Fruit juice x unprocessed fruit
Sodium content
Sodium content in sausage
Cholesterol content
Fat content
Fat
Fat x cholesterol
Fat content in eggs
Fat content in bread
With DM
Without DM
With DM
Without DM
With DM
Without DM
With HBP
Without HBP
With HBP
Without HBP
With abnormal LDL
With normal LDL
With atherosclerosis
Without atherosclerosis
With atherosclerosis
Without atherosclerosis
With atherosclerosis
Without atherosclerosis
With atherosclerosis
Without atherosclerosis
With atherosclerosis
Without atherosclerosis
68.7
0.04
0.02
0.02
0.02
0.07
0.00
0.00
0.09
0.01
0.01
0.01
82.4
13.8
27.9
61.5
32.4
54.7
68.9
59.3
70.6
43.6
60
52.9
92.5
92.5
76.9
37.1
23.1
74.8
61.5
56
72.1